CRYPTO N FOREX
Trade Invest Profits Rewards

Trading analysis mean, the trader uses the data to forecast and identify trading opportunities of market development and to determine a market trending.
The trading activity and price changes in the past, can be important indicators of future price movements.
Basic of trading analysis can be vary, it consist of various strategies, techniques, guidelines, and various types of charts and patents used by traders to analyze the market, by creating and developing their own trading system.
The “trading system” is a guideline (S.O.P):
• Indicates and determines when is the right time to enter the market and exit point,
• Stop loss place
• Potential price movements and break-evens.
• Capital management: frequency of trading, risk level, conditions when trading needs to be stopped to avoid further losses due to price versus entry, and so on.
TECHNICAL ANALYSIS
|
ANALISA FUNDAMENTALSentiment analysis on economic, social and political power over supply and demand.
|
|||
* (This type of analysis does not take into account factors such as world economy and political events.)
|
In order to develop your own “trading system”, a basic knowledge of the key principles of trading analysis must be understood as it can distinguish:
1. Trading with Trend Trade Trend.
2. Retracement (Reverse) or Reversal (Reverse).
3. Supply or Demand to measure Support and Resistance.
Failure to understand the basics of market analysis will have a negative impact on trading and placement;
1. The risk of getting out of the entry too quickly results in lost opportunity.
2. The risk of holding or floating (entry) trading in the negative position for too long (not positioning or removing the Stop Loss level) ultimately accounts for the margin call.
Make It Easy to Trade With Trend. As a trader (crypto & forex) are familiar with the words “trend is your friend” and “don’t fight the trend”.
Trend Trading is a trading style profiting through analyzing momentum in a certain direction.
Trader will look for a long-term buy out when the pair is moving upwards or a short-term opportunity when the pair’s momentum is declining.
In fact, most traders always have trouble identifying trends. So how do we determine the trend?
Use high time frames such as H1, H4, D1, M1 and MN (depending on your trading style scalping, intraday, Swing or position) to determine or evaluate current trends:
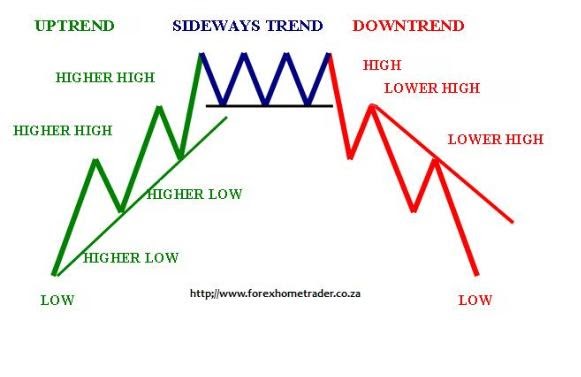
1. UPTREND: Consists of moving higher highs and higher lows.
2.DOWNTREND: Price movements consist of lower highs and lows.
3. RANGGING or SIDEWAY consists of highs and lows and they are not in the category of trend !!!
The direction of an uptrend or downtrend is the best potential for a position (buy / sell). While rangging or sideways can negatively impact your trading.
STRATEGY is an organized plan to achieve a goals or achievements. Strategy is also the discretion of the approach, as well as the ability to design TECHNICS or methods based on objectives. Traders need to be good at taking OPPORTUNITIES and handling RISK.
The Moving Average indicator can help traders identify trends, based on the following time periods:
TIME FRAME ENTRY
|
MOVING AVERAGE SETTING
|
HIGHER TIME FRAME
|
TYPE OF TRADER
|
M5 or M15
|
8, 12 or 32
|
M30 OR H1
|
SCALPER
|
H1
|
50 or 100
|
H4 OR D1
|
INTRADER
|
D1
|
100 or 200
|
W1 OR MN
|
SWINGER
|
Currency market prices will not always increase or continue to decline, they will have a reversal or a correction.
|
Retracement |
Reversal |
The reversal is temporary in the trend of higher highs, followed by higher lows in the uptrend and lower lows followed by lower highs in the downtrend.
|
When trends change, Reversals are often characterized by chart patterns.
|
By recognizing the movement as a retrace or reversal in a high time frame, you can reduce costs, reduce losses and maintain profitability.
Example:
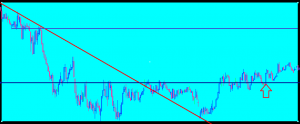
1- The M15 time frame has shown a reversal of the trend (from bearish to bullish) following breakout at trendline (arrow)
2- Trader open a “buy position“.
3- But the position hit a “Stop Loss“.
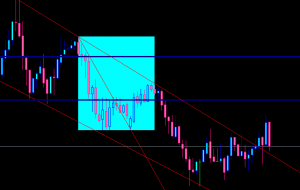
4- On higher time frame (H1) the price have formed “a correction” at M15 and should not open long / buy entry.
CAUTION : Do not use lower timeframes such M1 M5 M15 to identify trends – it require more attention, prices move faster and need to be more careful as many false signal will be occured.
It is important to know the signal of reversal or correction
1. To detect an entry or reentry positions in line with market trends.
2. Signal to exit an entry.
Retrace : The most popular way to identify a correction is to use Fibonacci levels.
Reversal : can potentially change in different ways; They can be measured through;
1- Trend lines and trend channels:
alerts and confirmations the termination of a trend when the price crosses a trend line or channel trend after meeting the valid breakout. If the price of the pair is still within the Trend Channel area, it shows that the currency pair’s momentum is still strong to continue the current trend. >>Click for More into Using Trend Line and Trend Channel<<
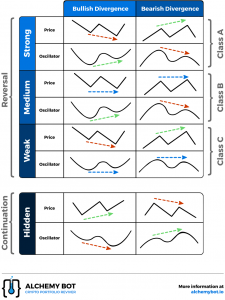
2- Divergence:
when the trend is not supported by sufficient momentum.
The price is higher and lower, but the indicator does not confirm the price action of the same level, so the probability of continuation of the trend decreases.
3- Candlestick Pattern:
Candlesticks is a great indication of the ending or changing of a trend.
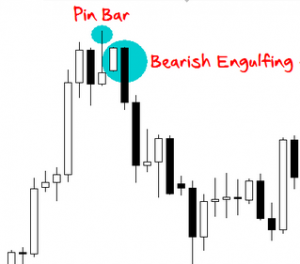
Pinbar or engulfing is a candlestick that shows the tendency of the market to lose its momentum and begin to reverse the trend. >> Further profitable patterns <<
4- Support and resistance <“Price Action @ Naked Trading”>
Can be measured by using Trendline or Trendchannel, Fibonacci retracement / trendline / moving average indicator / Fibonacci targets / Fibonacci extension.
it is important to note the obstacles that can hinder the momentum from continuing the trend by checking the resistance (during uptrend) or support (during downtrend). Momentum is passing through the Support or Resistance area as a confirmation that a trend is still strong.
While the bounce movement within the Support or Resistance area is a confirmation that the Support or Resistance level is overbought or oversold.
5- Chart Pattern:
Head and shoulders, inverse head and shoulders, rising wedges, falling wedges, double top, double bottom, triple top, dan triple bottom is a type of chart pattern that shows the lack or tendency of a trend.
Confirmation completes a pattern as the price momentum surge “neckline”
6- Weakness level Lower highs and higher lows
The trend is confirmed as it continues to move lower lows and higher highs. If the trend is unable to penetrate the resistance or support and the price is forming lower and higher low, then the trend is weakening.
7- Elliott Wave
By calculating the wave (impulse) and sub-waves, trader can improve the understanding of market structure and provide a more accurate picture of a given scenario.
8- Technical Indicators
The used of indicator such Moving Average, Bollinger bands, oscillator and many more.
http://forexrobotnation.com
Very educational, thanks for keeping us all up to date in relation to your trading
development.
Forex Steam Live Results
Thank you for this, I am going to unquestionably talk about it with my favorite
followers.
Rameena abp
Drawing trend lines is one of the few easy techniques that really WORK. Prices respect a trend line, or break through it resulting in a massive move. Drawing good trend lines is the MOST REWARDING skill.
The problem is, as you may have already experienced, too many false breakouts. You see trend lines everywhere, however not all trend lines should be considered. You have to distinguish between STRONG and WEAK trend lines.
One good guideline is that a strong trend line should have AT LEAST THREE touching points. Trend lines with more than four touching points are MONSTER trend lines and you should be always prepared for the massive breakout!
This sophisticated software automatically draws only the strongest trend lines and recognizes the most reliable chart patterns formed by trend lines…
http://www.forextrendy.com?kdhfhs93874
Chart patterns such as “Triangles, Flags and Wedges” are price formations that will provide you with consistent profits.
Before the age of computing power, the professionals used to analyze every single chart to search for chart patterns. This kind of analysis was very time consuming, but it was worth it. Now it’s time to use powerful dedicated computers that will do the job for you:
http://www.forextrendy.com?kdhfhs93874